Your iPhone as a measuring instrument.
Sensorstorm records every iPhone sensor at once on one clock, documents findings on site and checks network and Bluetooth.


Acceleration g100 Hzx0.006y0.005z0.0030:34.1
Record every sensor
Motion, GPS, air pressure, sound and video
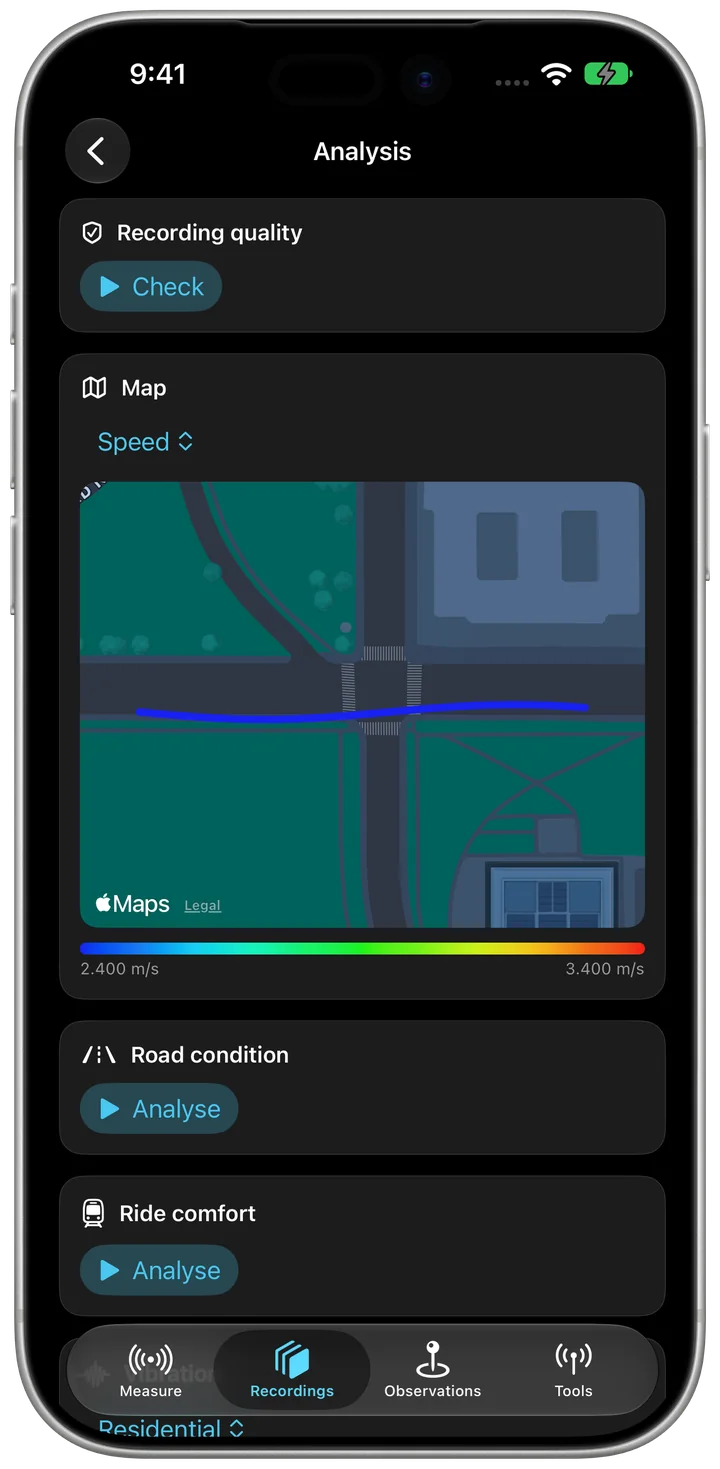
Video and curves play in sync, every value lines up with its frame. Analysis for road condition, ride comfort and vibration, map colored by value.
A real Sensorstorm recording: 20 data streams on one clock, 95 seconds during a 3D scan.
0:34.11:34.9
| Acceleration g | 100 Hz | x0.006y0.005z0.003 |
|---|---|---|
| Rotation rate rad/s | 100 Hz | x−0.02y0.02z0.01 |
| Magnetic field µT | 100 Hz | x10.0y−34.6z−27.0 |
| LiDAR distance m | 60 Hz | 0.60 |
| Loudness dB | 10 Hz | −73.1 |
| Barometer m | 1 Hz | −0.62 |
Rotation rate rad/s100 Hzx−0.02y0.02z0.010:34.1
Video and curves in sync
Every value lines up with its frame
CSV, Excel, GeoJSON, GPX, KML, GeoPackage, Blender and more. Live streaming over MQTT.
Ready-made analysis
Vibration, ride comfort, road condition
LiDAR distance m60 Hz0.600:34.1
Now in 3D too
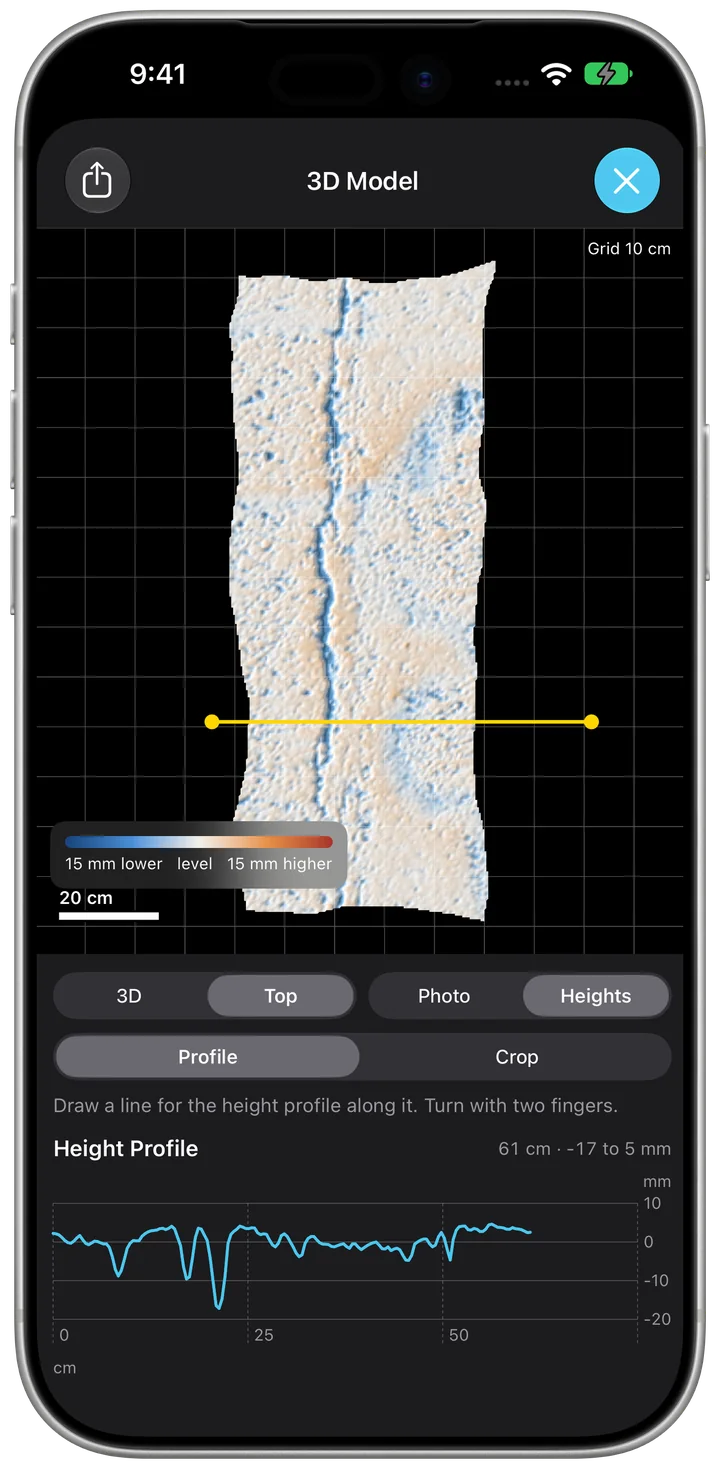
Cracks with LiDAR, heights and volume
Acceleration, rotation rate, attitude, magnetic field, GPS, air pressure and altitude, sound in decibels, light, video up to 4K. Plus wrist motion from Apple Watch, Bluetooth sensors, LiDAR distance and more. You choose what gets measured, up to 100 Hz.
Height profile with one swipe
Top view with grid, scale bar and crop
Magnetic field µT100 Hzx10.0y−34.6z−27.00:34.1
Document findings on site
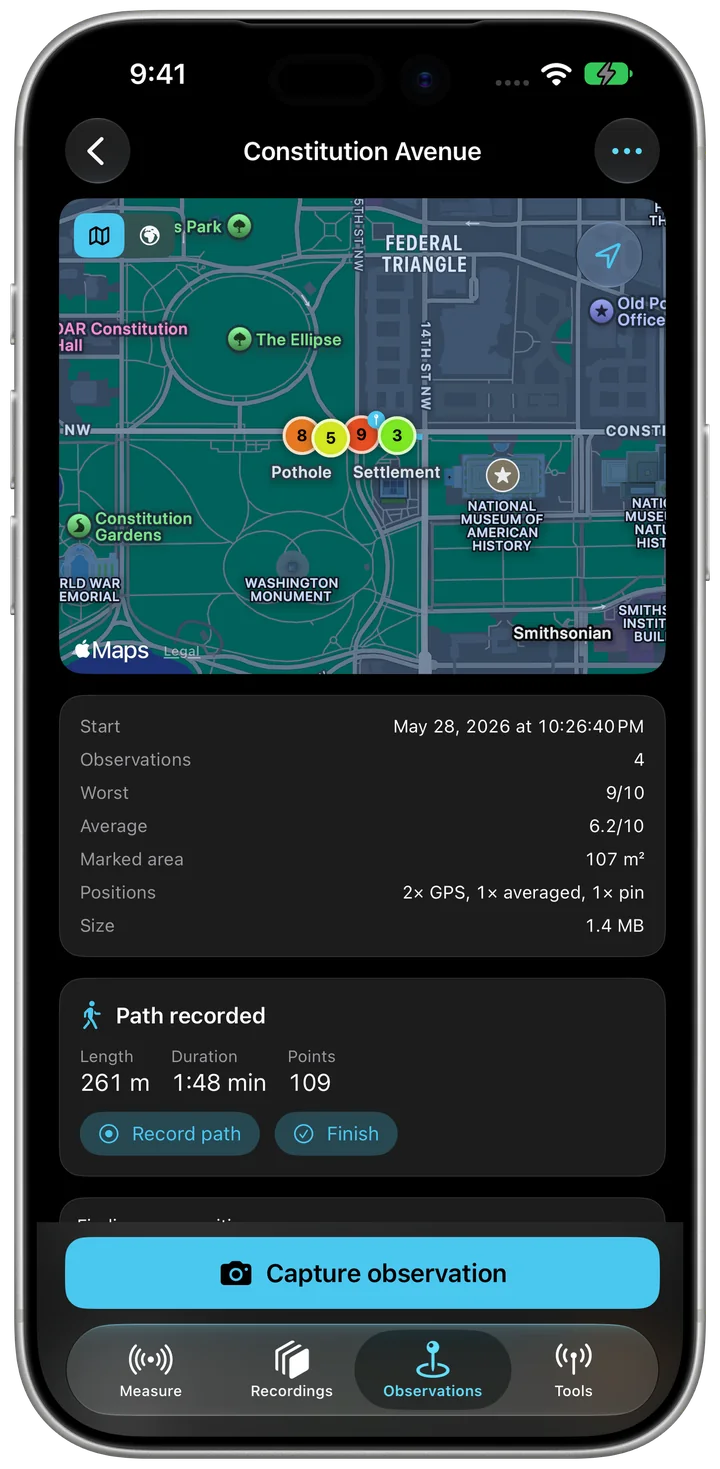
Routes with photo, severity and accuracy
Capture surfaces, cracks and objects in 3D with LiDAR, model built to scale right on your iPhone. Top view with grid, height colors and height profile. Needs an iPhone or iPad with LiDAR.
Loudness dB10 Hz−73.10:34.1
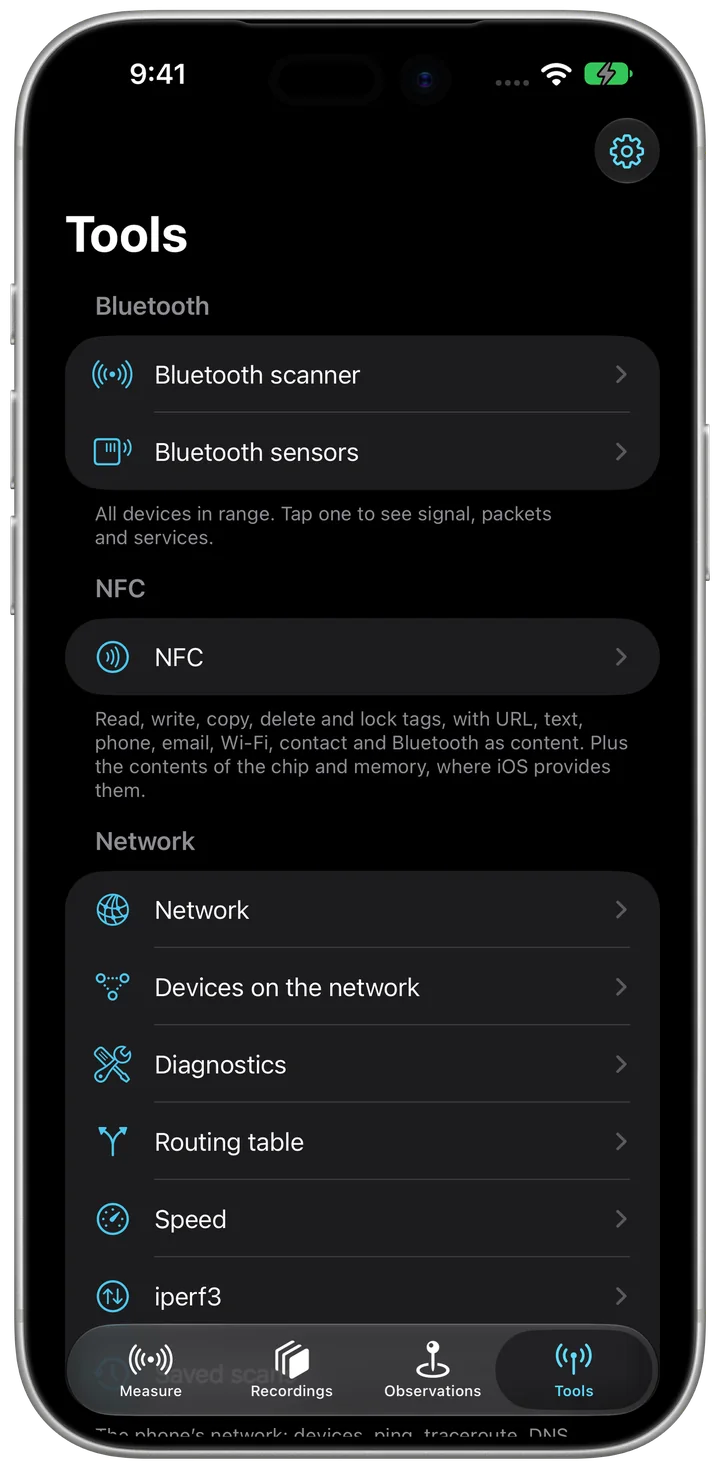
Network, Bluetooth, NFC
Scanners and diagnostics, no extra hardware
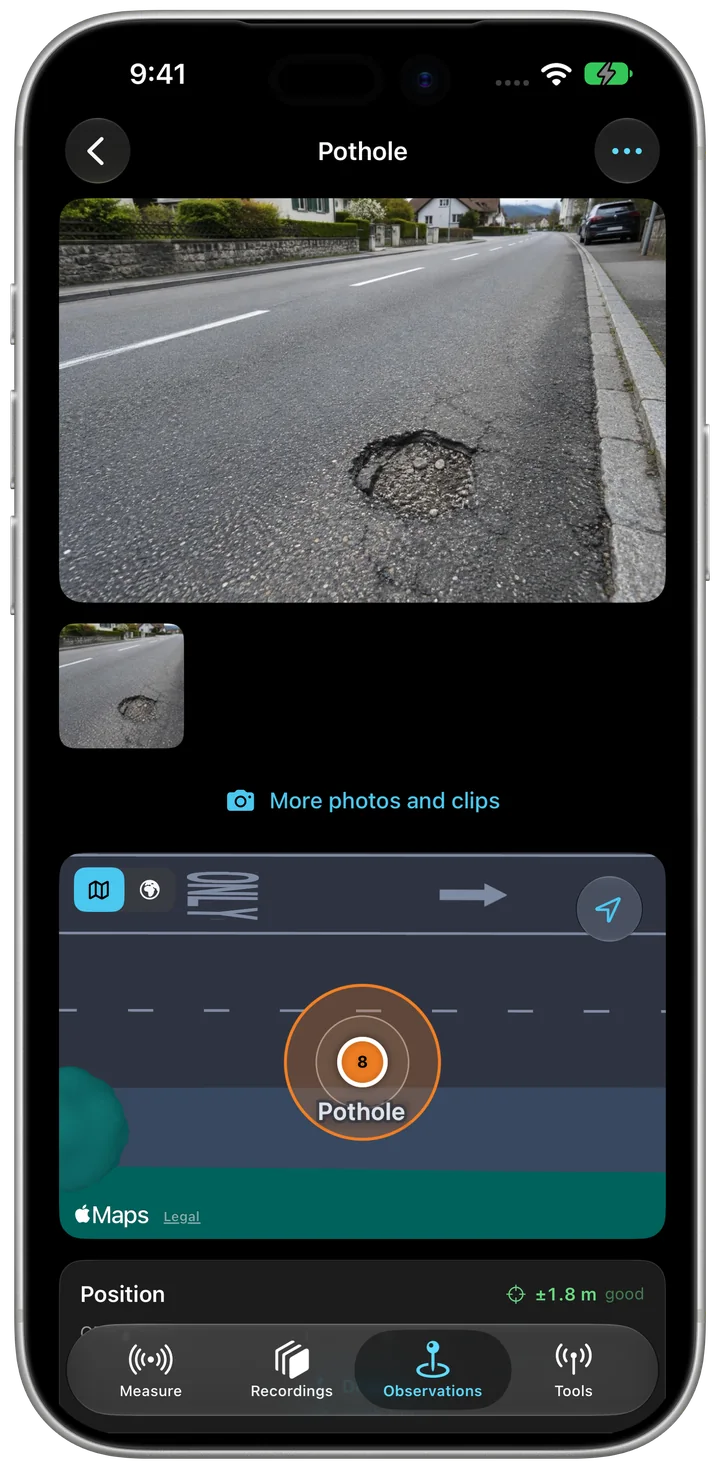
Document damage with photo, severity and honest position accuracy. swisstopo maps, offline too. PDF report.
Tools: Bluetooth and NFC
- Bluetooth scannerEvery device in range with signal, manufacturer, packets and services
- Find a device by soundThe closer it is, the faster the ticking
- Services and characteristicsRead, subscribe, write, as hex, text or number
- Read as numbersYour own fields with factor and unit, logged and shared as a log
- Sighting historyWhich device was nearby when, as a table
- NFC: Read tagContent, chip, manufacturer and memory
- NFC: WriteURL, text, phone, email, location, Wi-Fi, contact and Bluetooth
- NFC: Copy tag, Delete tag, Set write protection
- NFC libraryKeep read and self-made content for later
Tools: Network
- NetworkWi-Fi, router, addresses, IPv6, DNS servers, proxy and mobile
- Look up public addressWith provider and country
- Devices on the networkWith names, services and open ports
- Saved scansWhat has changed on the network
- Acceptance report as PDF
- Ping and tracerouteWith operator and country of every router
- DNS lookupCompare across all servers
- Port scan, Check certificate, HTTP test
- Test MQTT broker and Wake-on-LAN
- Routing table
- Speed and iperf3Download, upload and latency under load
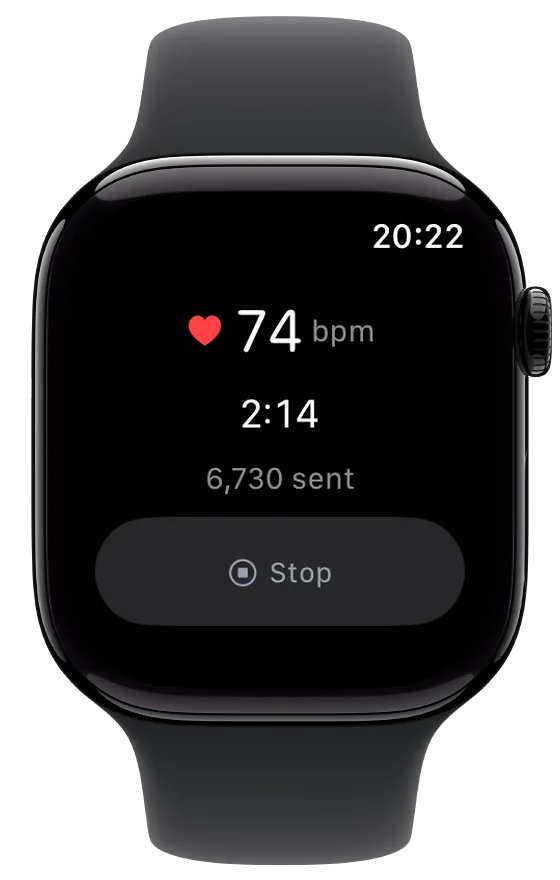
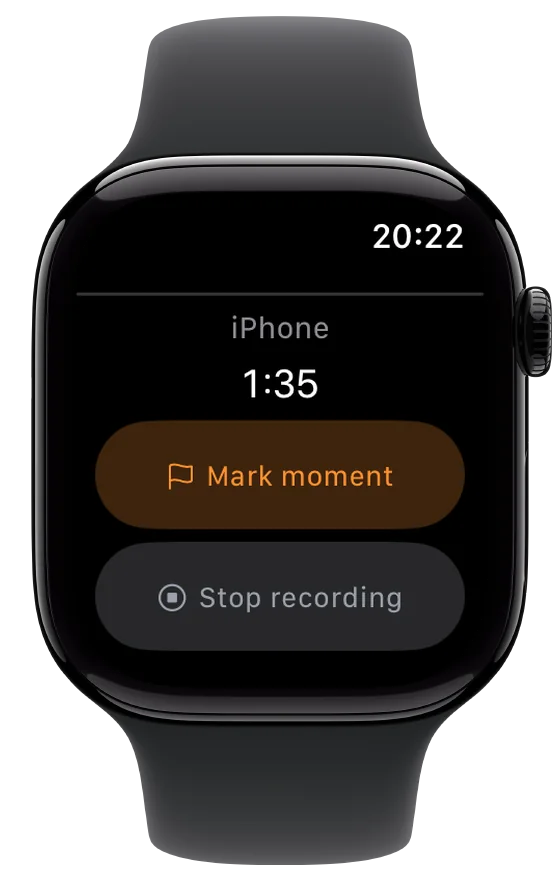
And on your wrist
Barometer m1 Hz−0.620:34.1
What Sensorstorm does
Every feature, grouped the way the app is. Anything that needs Sensorstorm Pro is marked (Pro).
Sensors in the iPhone
- MotionAcceleration, rotation rate, gravity, orientation, magnetic field, vertical acceleration, plus the raw values
- CompassHeading to north, true and magnetic
- GPSPosition, altitude, speed and course with accuracy
- BarometerAir pressure and relative altitude, with “Zero the altitude here”
- Loudness and Loudness dB(A)Sound level with a sound level meter's weighting
- Pedometer and ActivitySteps, and whether you stand, walk, run, cycle or ride in a vehicle
- DeviceBattery, brightness, network, Bluetooth nearby and thermal state
- AirPods orientationHead motion with AirPods
- Video and audioBack or front camera at 720p, 1080p or 4K (Pro), without image stabilisation
- Camera pose (Pro)Position, heading and focal length for every frame, via ARKit
More sources
- Absolute altitudeHeight above sea level from GPS and barometer together
- Frequency bandsTen octave bands and the dominant frequency
- Sound classesRecognises sirens, engines or dogs, on the device
- LiDAR distanceDistance to the centre of the image, up to about five metres
- Brightness via the cameraEstimated ambient brightness
- iBeaconsSignal and distance to beacons with your identifiers
- UWB distance to second iPhoneDistance and direction by ultra-wideband
- Storage and audio routeExplains gaps when storage fills up or a microphone is unplugged
Bluetooth sensors
- RuuviTag, BTHome, Xiaomi with ATC/pvvxValues go straight into the recording
- Heart-rate straps, power meters, running sensorsReconnect on every launch
- Custom decodersMake any device readable with a small JavaScript file
- Log raw Bluetooth advertisementsEvery packet with signal strength, to decode later
Measure and record
- Every sensor on one clockEvery value and every video frame on the same time base
- Sample rate 10 to 100 HzThe same for everyone, with or without Pro
- Work profileGeneral, roads and paths, buildings and façades, lift, train, tram and bus, construction site and vibration, network and radio, sound, research and datasets
- Live tiles with historyOne tap shows value, history and map, even without recording
- Add annotationMark a moment with a note
- Calibrate microphoneAgainst a calibrator or sound level meter, for real dB values
- Keep screen awakeAnd with Location set to “Always”, keep recording while the screen is locked
- Measure the clock against a time serverSo two devices can later share one timeline
- Log network qualityLatency, loss and Wi-Fi signal every second
View and analyse
- Synchronised playbackVideo and curves with playhead, zoom and 5 s jumps
- Recording qualityChecks gaps and rate, report as PDF
- MapPath coloured by speed, altitude, accuracy, loudness, vertical acceleration or air pressure
- Road conditionRough sections and impacts, can become observations
- Ride comfortBased on EN 12299, for train, tram and bus
- Lift journeysSpeed, acceleration, braking, jerk and vibration, based on ISO 18738
- VibrationVibration velocity against the DIN 4150-3 guide values, per building class
- Dataset for machine learningNotes as labels, folders for Create ML
Export
- Export as CSVOne file per sensor, with video and metadata, always free
- GPS track as GPX and as KMLFree
- All sensors in one table (Pro)
- JSON, SQLite database, Excel workbook (Pro)
- Export raw data (Pro)Lossless and compact
- Camera move for Blender (Pro)An animated camera that follows the real recording
- Images for photogrammetry (Pro)With EXIF, camera table and COLMAP model for RealityScan, Metashape or Meshroom
- Sensor Logger and Gyroflow log (Pro)For other apps and video stabilisation
- Full export (Pro)Every route, photo and recording in one archive
- Import archiveBring data over from another device
Observations on site
- Routes with observationsOne route free, more with Pro
- Photos and clipsSeveral per observation
- Honest positionAveraged GPS, pin by hand, accuracy circle, WGS84 and LV95
- Severity 1 to 10 and statusOpen, Planned, Done, No action needed
- CataloguesRoad condition, building and facade, green spaces and trees, lighting and street furniture
- Mark areaAs a circle or polygon, with its size
- MeasurementsSlope, depth, width, length, quantity, and the volume from them
- Measure slopeWith the phone flat on the surface
- Record pathEven with the screen locked
- Repeat inspectionNew, Done, Worse, Better or Unchanged
- Scan checkpointNFC stickers on inspected objects
- Swiss topo mapsMap or aerial image, and with “Download map for offline use” without a connection
- Search address and DirectionsThe address of a spot and the way there in Maps
- Merge routes
- Pixelate faces and number plates in exports
- Inspection report (PDF) (Pro)
- Export routesCSV free; GeoJSON, GeoPackage, KML, KMZ with photos, GPX and bundle with photos with Pro
- Forward observationsBy webhook or Open311 to a municipality's issue reporter
Send and connect
- Stream live to a server (Pro)Every sample as JSON, in Sensor Logger's format
- Also to an MQTT broker (Pro)For Node-RED or Home Assistant
- Available over Wi-Fi (Pro)The values in a browser, or as JSON at /data
- Second iPhoneWith clock sync, start and stop together
- Offer as Bluetooth sensorOther devices read the measurements, with remote control if you like
Automatic
- RulesOn a reading, location, recording duration, MQTT message or external device: notification, add annotation or stop recording
- Event recordingKeeps the seconds around an impact, without a running recording
- Shortcuts and SiriStart recording, Stop recording, Mark moment, Record path, Pause path, Scan network
- Observation at my locationFor the Action button, without opening the app
Apple Watch
- Start and stop recording from your wrist
- Mark moment
- Wrist motionAcceleration, rotation and attitude while the watch app is open
Private
- No account, no ads, no tracking
- Your data stays on your deviceUntil you export it yourself
- Buy Pro once, no subscriptionCSV, GPX and KML always stay free
- iPhone and iPadWith columns on iPad
- 27 languages
Frequent questions
Does the app need an account?
No. There is no sign-in, and every recording stays on your device.
Is Pro a subscription?
No. Buy it once and it never expires. Family Sharing works too.
Can I get my data out without Pro?
Always. CSV, GPX and KML stay free.
The position is a few metres off. Why?
That is how accurate GPS is. When capturing an observation, stand still and tap “Measure” so the app averages the fixes. Or place the spot by hand with “Pin”.
Recording stops when the screen locks.
In iOS Settings, set Location for Sensorstorm to “Always”. The recording then keeps running.
I can't see a sensor.
On the “Measure” tab, tap the sensor count top right. That is where you switch on sensors, more sources and Bluetooth sensors.
 Sensorstorm
Free for iPhone and iPad
- What
- A measuring instrument for every iPhone sensor, on one shared clock
- For
- iPhone and iPad, plus Apple Watch
- Account
- None
- Data
- Stays on your device until you export it yourself
- Network
- None to measure. Maps and network tools only when you use them